


Challenges in Time-Based Sales Data Analysis
Effective data analysis is crucial for any business. Power BI is a powerful data visualization tool that allows you to turn data into actionable insights. However, challenges arise when comparing time-based data analysis. The business decision makers wish to compare their revenue for the time period of their choice. Power BI’s built-in DAX function lacks this capability. Consequently, we’ve developed a solution that addresses this need.
Solution Overview
By incorporating various time-based DAX calculations in Power BI, we offer robust visualizations to tackle this challenge effectively. Consequently, this solution greatly benefits industries by providing profound insights into historical trends. Our dashboard empowers users to seamlessly compare sales data for two distinct years of their choosing. This, in turn, facilitates a comprehensive analysis of revenue fluctuations, both on a monthly and yearly basis.
Year over Year (YoY) sale analysis involves comparing sale or financial metrics between two user-selected years. As a result, industries can gain a deeper understanding of their financial performance over time. Henceforth, enabling them to make well-informed decisions for sustainable growth and success.”
Discover how our solution can drive business growth through comprehensive revenue analysis. Before delving into dashboard creation, ensure you have the following prerequisites.
Data Preparation
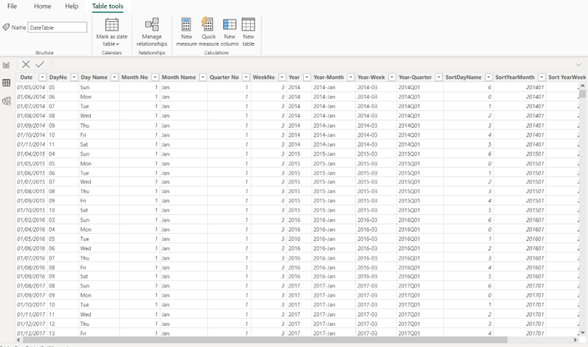
Ensure you have a dataset with a sales amount column (‘Sales’). You need to have two separate date tables for Initial Year and Final Year . Each date table has a ‘Year’, ‘Month’ and ‘Date’ column.
Writing DAX Measures
Initial Year and Final Year YoY Sales Measures
We’ll create IY Sale YoY and FY Sale YoY measures to calculate initial year and the final year Sale respectively.
Create a Measure for Selected Initial Year Revenue
This measure calculates the total revenue for the Selected Initial Year
IY Sale YoY =
VAR IYStartDate = [ get the first day of the selected initial year]
VAR IYLastDate= [get the last day of the selected initial year]
VAR Period=DATESBETWEEN( InitialYearDateTable [Date],IYStartDate, IYLastDate)
RETURN
CALCULATE(SUM(‘Sales[Revenue]), Period)
Create a Measure for Selected Final Year Revenue
This measure calculates the total revenue for the Selected Final Year
FY Sale YoY =
VAR FYStartDate=[ get the first day of the selected final year]
VAR FYLastDate= [get the last day of the selected final year]
VAR Period =DATESBETWEEN (FinalYearDateTable'[Date],FYStartDate, FYLastDate)
RETURN
CALCULATE SUM (‘Sales [Revenue]), Period)
Create a Percentage Difference Measure
This measure calculates the percentage difference between Year to Year sales for the Initial Year and the Final Year:
Difference Sale % = [Calculate the % difference between the sale of initial and final year]
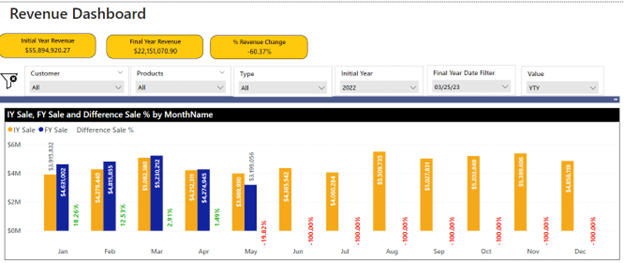
Visualization and Interpretation
Create a bar chart visual with ‘Month’ on x axis. Add YTY Sale for initial year, final year. Then add %difference measure in the values section of the table visual.
Set Date Slicers
Moreover, slicers in Power BI facilitate precise date range selection, enhancing user analysis. Add slicers for the ‘Initial Year’ and ‘Final Year’.
Building the Dashboard
Open Power BI Desktop and import your data.
Create visuals for your dashboard. You can use tables, line charts, or any other visualizations that suit your preferences. Then, place ‘Date'[Month] on the axis for time-based comparisons.
In your visuals, use the DAX measures created earlier i.e. YoY Initial Year Sales, YoY Final Year Sales, and Percentage Difference. Additionally, incorporate slicers for more tailored analysis.
Conclusion
A Power BI dashboard, featuring initial and final year sales comparison using YoY DAX calculations, becomes a powerful analytic solution. Hence, this solution offers valuable insights for businesses, aiding in their growth and decision-making.